
Last updated 9 Oct 2026
Analytics shows how your business is doing: what you've sold, where it came from and who's buying.
Open Analytics
Go to Analytics in the sidebar. Use the tabs to switch between Sales, Website, Products, Customers and Fulfillment, and the date range at the top right to change the period.
Sales
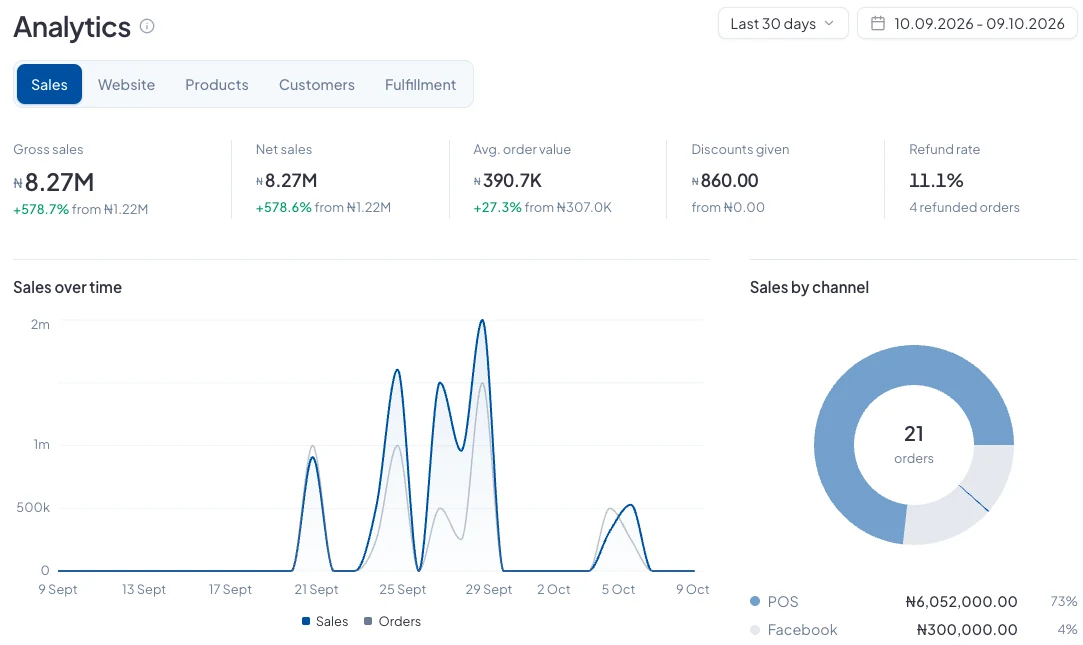
At the top are Gross sales, Net sales, Avg. order value, Discounts given and your Refund rate, each compared with the period before. Below them, Sales over time charts your sales and orders, and Sales by channel shows how much came from POS, your website, WhatsApp, Instagram and the rest.
Customers
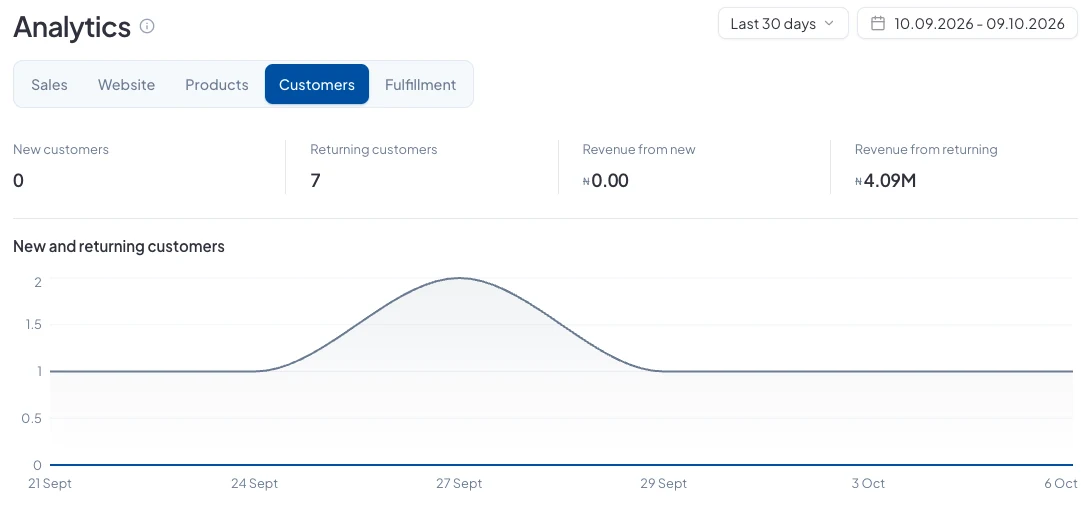
See how many New customers and Returning customers bought from you, and how much revenue came from each.
The other tabs
Website, Products and Fulfillment break down your store's visits, how each product is selling, and how orders are being fulfilled.
Good to know
- How far back you can look depends on your plan: 30 days on Starter, 90 on Growth and a year on Pro.
- For a quick answer, ask Zuri on your dashboard, for example “How much did I sell last week?”.
Did this answer your question? Contact support if you need more help.